Monitoring a distributed system is important to identify potential failures, security issues, bottlenecks and in general to understand how our application is performing to apply remediations (that could be scaling or redesigning some parts). In a distributed system, with several interconnected components, a dynamic environment, and unreliable networks, this becomes challenging.
Dapr, with his runtime running as a "sidecar", is the central point where the instrumentation of monitoring takes place to have distributed tracing, logging, metrics, and health check; as everything in Dapr, we can just configure these features using a YAML file.
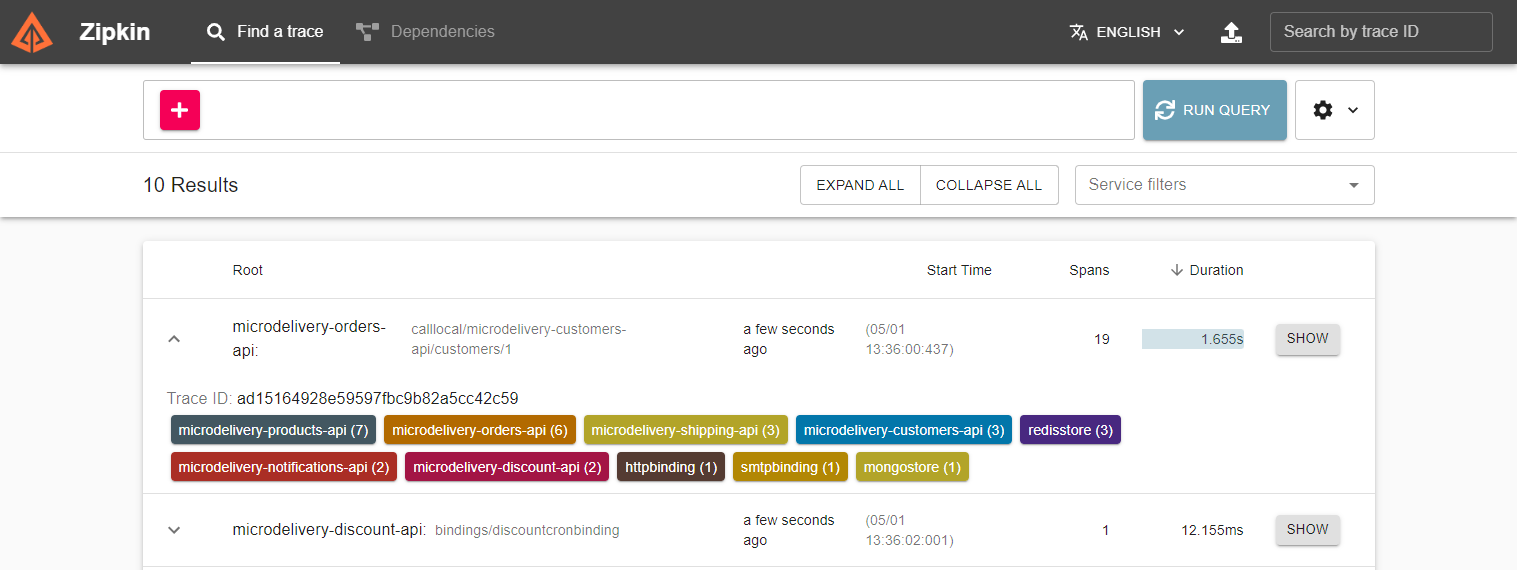
In our sample, we'll use Zipkin to collect tracing information, just by specifying the Zipkin endpoint and the sampling rate (0= disable trace, 1 trace all)
apiVersion: dapr.io/v1alpha
kind: Configuration
metadata:   name: daprConfig
spec:   tracing:     samplingRate: "1"     zipkin:       endpointAddress: "http://zipkin:9411/api/v2/spans"1
In the Zipkin UI, we can see both traces and services dependencies
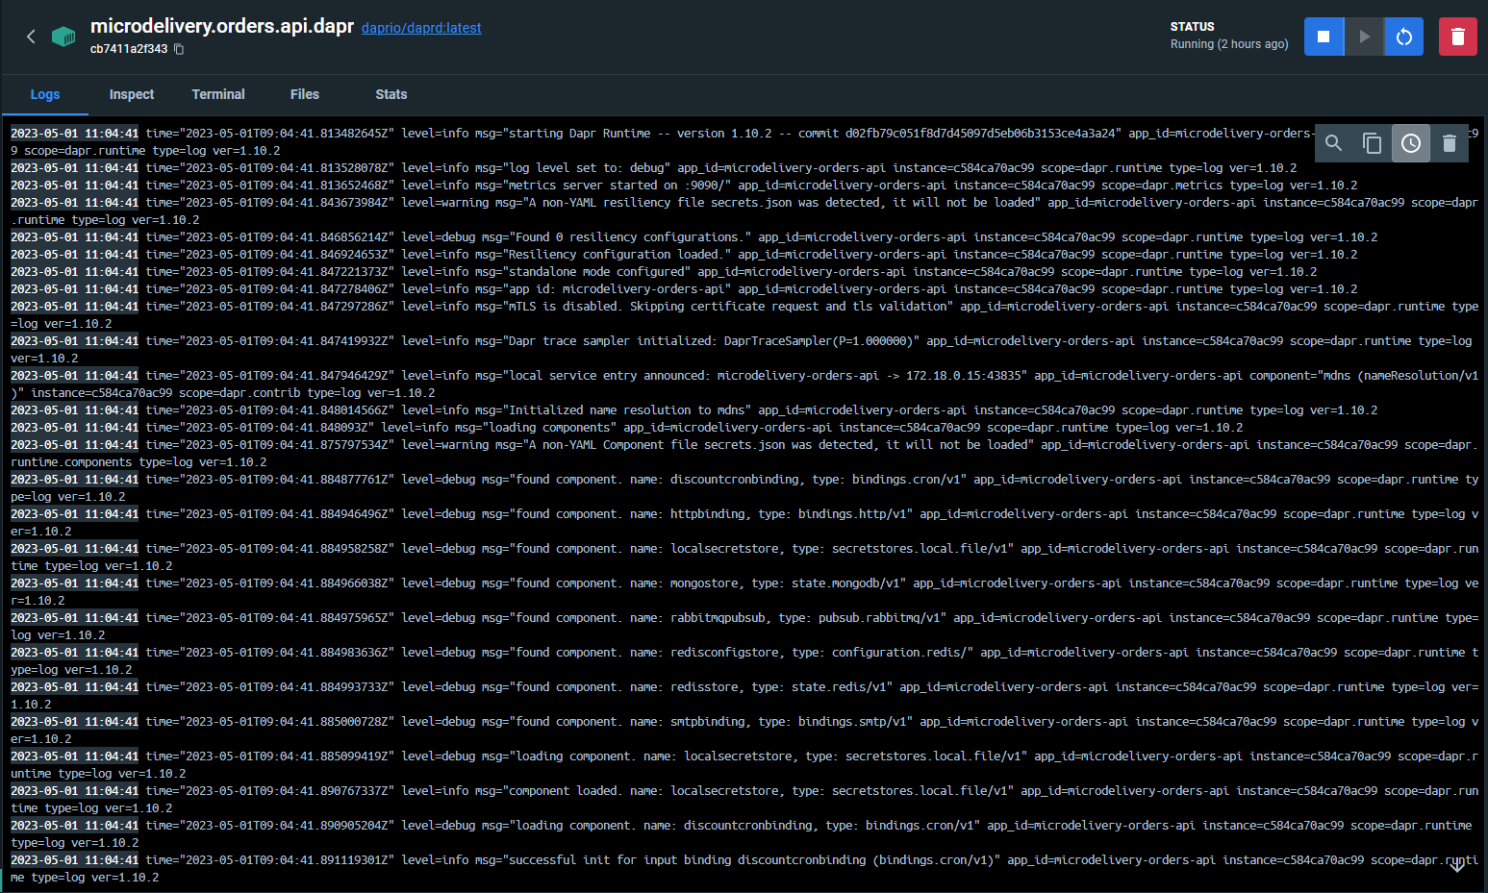
Dapr can produce structured logs in plain text (the default, that also sends it to stdout) or JSON (better for storing them in external services like ELK).
We can also use Open Telemetry Collector, Jaeger, and other tools like New Relic and App Insights.
See you in the next article for the last one of this series.